

Many people often confuse Row Context with Filter Context due to naming as Filter Context is created from the “rows” of a table visualization in a lot of cases. To explore Row Context in more detail, check out the article below.
Row Context:
Row Context in DAX refers to the context of a single row in a table, where calculations are performed iteratively—naturally in Calculated Columns and within iterators in Measures.
Notes to Keep in mind:
- Calculated Columns have a built-in Row context.
- Measures do not have a built-in row context, but you can introduce a row context by using function like:
– SUMX()
– MAXX()
– MINX() - Differences between Calculated Columns and Measures are explained in detail in this article Measures vs Calculated Columns.
Explanation Through Story Telling:

It is ‘know your classmate day’, and excitement buzzed through the classroom as students proudly displayed their most cherished items. Sarah showcased her colorful pet chameleon, Max flaunted his well-worn skateboard, while Timmy was sitting with a grin on his face, waiting for someone to ask about the impressive collection of marbles spread out on his desk.
The colorful marble collection caught the attention of all the kids at school, some even tried to grab a marble or two, but Timmy wasn’t that easy going with his collection, he insisted that whoever wants a marble can state its color and size and Timmy will get it and sell it to them during breaktime.
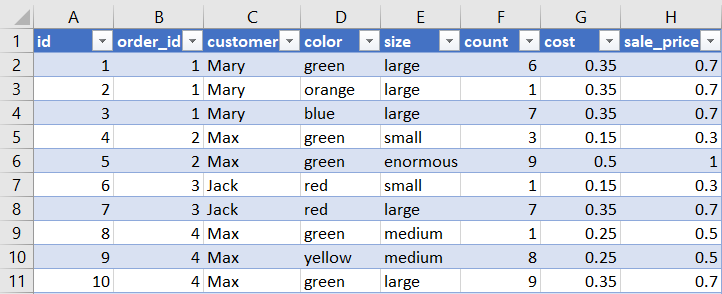
Timmy’s business was booming, and before long, he was the go-to marble dealer for all the 6th graders. But as orders flooded in day and night, he had no choice but to track them in an Excel sheet.
Timmy wanted to use the profit to buy a ceramic display for his marble collection, but first of all he wanted to determine his biggest customer and his biggest order, so he could write a personal letter for each, thanking them for giving him the chance to boost his hobby to the next step.
Timmy read the notes, that’s why he knew that are two ways upon which he can approach this problem to find a solution either by using:
- Calculated Columns
- Measures
Solution A: Using Measures
As stated in the notes, Measures do not have their own built-in Row Context and you must introduce it using a function, since Timmy wants to calculate the sum of profit gained from each of his customers, Timmy will use the SUMX function:
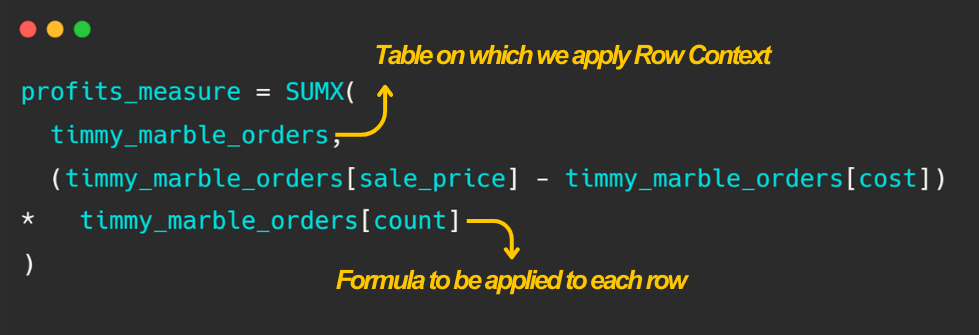
To calculate the profit Timmy deducts the cost of the marble from the sale price, then multiplies it by the number of marbles listed at that row. The SUMX function then proceeds to sum all of the different function results that were calculated for each row based on the current row context.
For example, based on the sample of the dataset provided above the SUMX function will iterate through the table as follows:
((0.7-0.35)*6) + ((0.7-0.35)*1) + ((0.7-0.35)*7) …. till the formula is applied to each row in the table.
The Measure does not create a new column in Timmy`s table and does not occupy space and only gets calculated when you add it to a created visualization, but more on that later.
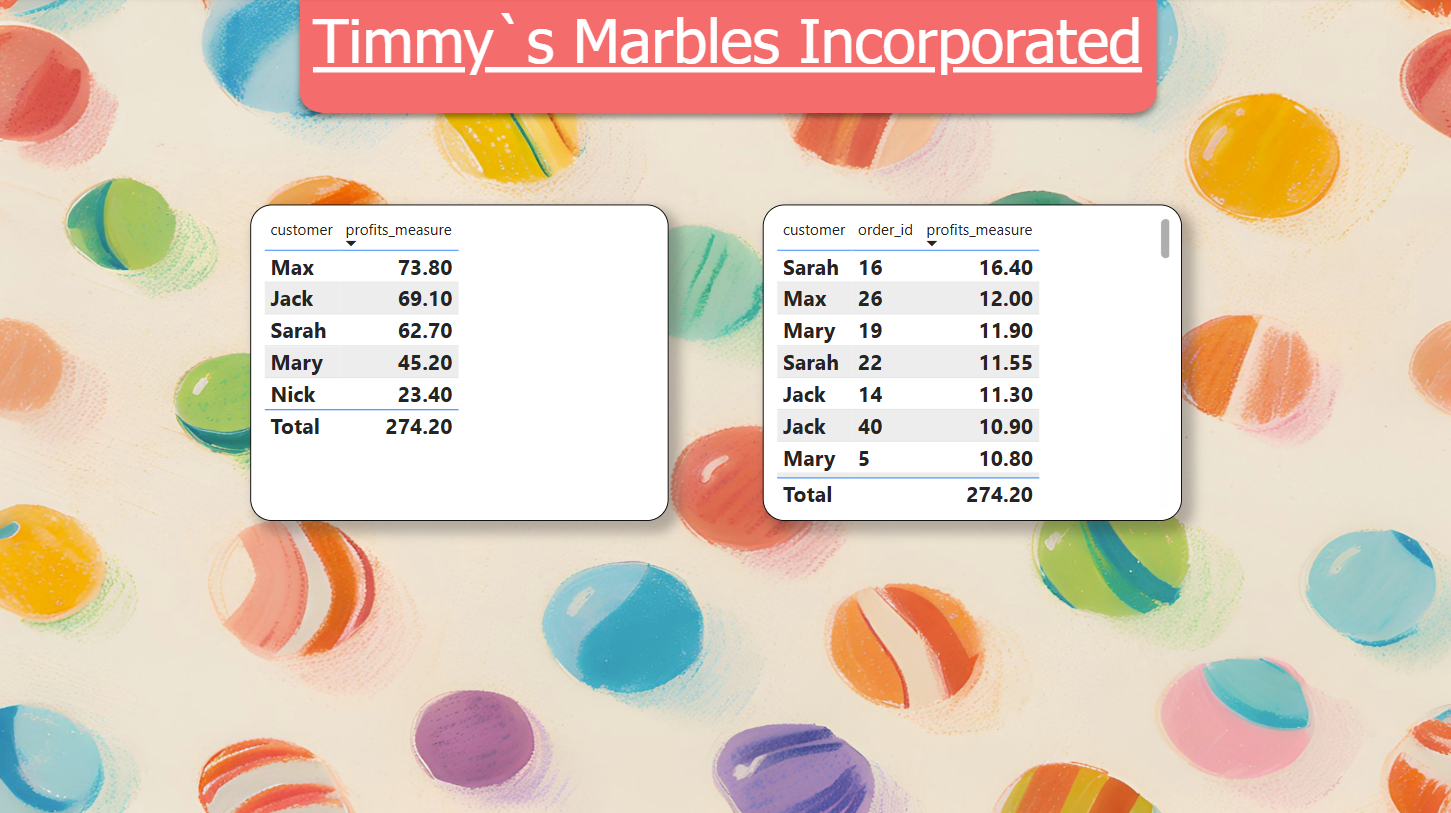
Timmy created 2 visuals:
- One with the customer column and the profit_measure, to find out who is his biggest customer.
- The other with the order_id, customer columns and the profit_measure, to find out who is the owner of his biggest order.
The values in the visual get broken down either by the customer or (order_id and customer) due to Power BI Filter Context for more information on that check:
Solution B: Using Calculated Columns
As stated in the notes, Calculated Columns have built-in Row Context, so the answer is pretty straightforward:
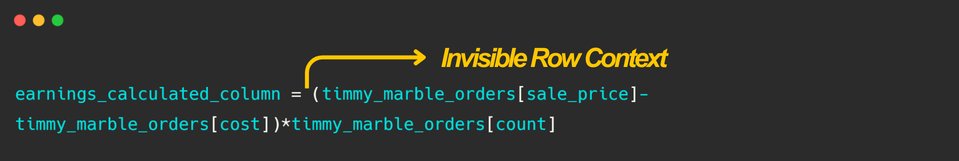
The Row Contest in a calculated column will allow the formula stated to be applied to each row in the table.
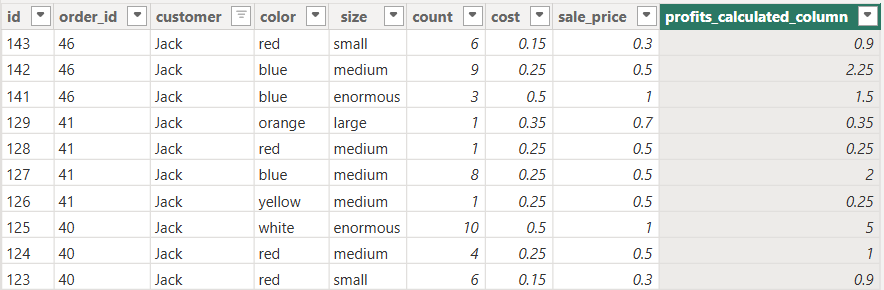
The Calculated Column will be stored in Timmy`s table and will increase the data model size but more on that later.

Timmy solved his problem using 2 different methods and made sure that:
- Max was his biggest customer, spending a total of 73.80$.
- Sarah had the biggest standalone order standing at 16.40$
Timmy took a day off from his extensive marble research to write a heartwarming thank you letter to each of Max and Sarah to show his appreciation and gratitude for their help.
Interpretation in Pandas Python:
import pandas as pd

pandas_dataframe = pd.read_csv("timmy_marble_orders.csv")
# Create a new profit column that calculate the profit of each row
pandas_dataframe["profits"] = (pandas_dataframe["sale_price"]-pandas_dataframe["cost"])*pandas_dataframe["count"]

'''
Group By using the customer only and aggregate the result based on the sum of
the profits column then sort the result by the profits column in descending
order.
'''
profits_by_customer = pandas_dataframe.groupby(by="customer").agg({"profits":"sum"}).sort_values(by="profits", ascending=False)

print(profits_by_customer)
'''
Group By using the order_id and customer and aggregate the result based on the
sum of the profits column then sort the result by the profits column in
descending order.
'''
profits_by_order_id_and_customer = pandas_dataframe.groupby(by=["order_id","customer"]).agg({"profits":"sum"}).sort_values(by="profits", ascending=False)

print(profits_by_order_id_and_customer)
Interpretation in SQL:
-- Biggest Customer
-- Select the customer name and calculated profit, then group it by the customer
-- and order it by the customer profit in descending order
SELECT
    customer,
    SUM((sale_price - cost) * counter) AS customer_profit
FROM timmy_marble_orders
GROUP BY customer
ORDER BY customer_profit DESC;

-- Biggest Order
-- Select the order_id, customer name and calculated profit, then group it by
-- the order_id and customer and order it by the order profit in descending order
SELECT
    order_id,
    customer,
    SUM((sale_price - cost) * counter) AS order_profit
FROM timmy_marble_orders
GROUP BY order_id, customer
ORDER BY order_profit DESC;


Leave a Reply