

When people hear “Power BI” they often think of its stunning visuals and interactive dashboards. However, the real magic happens behind the scenes with Data Analysis Expressions (DAX). DAX is the powerful formula language that drives Power BI’s data transformation and analytical capabilities. One of the fundamental concepts of DAX is the filter context, which plays a crucial role in determining how your expressions get calculated. In this article, I’ll explain what filter context is and how understanding it can help you unlock the full potential of your Power BI reports.
What is Power BI Filter Context?
Filter Contexts are Filters generated from Power BI Visuals and Slicers that allows you to control the subset on which a measure gets calculated, for example calculate the average salary of people living in Newyork City. (Newyork City limits the subset to people living in Newyork only)
Explanation Through Story Telling:
Timmy is fond of collecting marbles — red ones, blue ones, small ones, and big ones. Recently, he acquired his latest marble, an orange marble, which is the largest in his collection. Timmy’s collection stands at an impressive 230 marbles. However, Timmy feels like his hobby is getting out of hand, as he can’t keep track of his collection anymore (you could say that Timmy is losing his marbles).
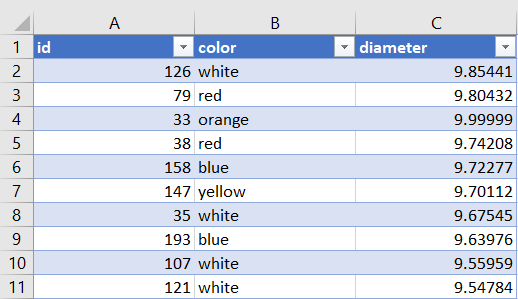
Timmy decided to create an excel sheet for his collection
Timmy wanted to check the largest and smallest marble for each color in his collection, so he created 2 measures:
Measure to calculate the largest Marble:
Largest Marble = MAX(timmy_marbles[diameter])
Measure to calculate the smallest Marble:
Smallest Marble = MIN(timmy_marbles[diameter])Timmy created a table visual and added the measures to it
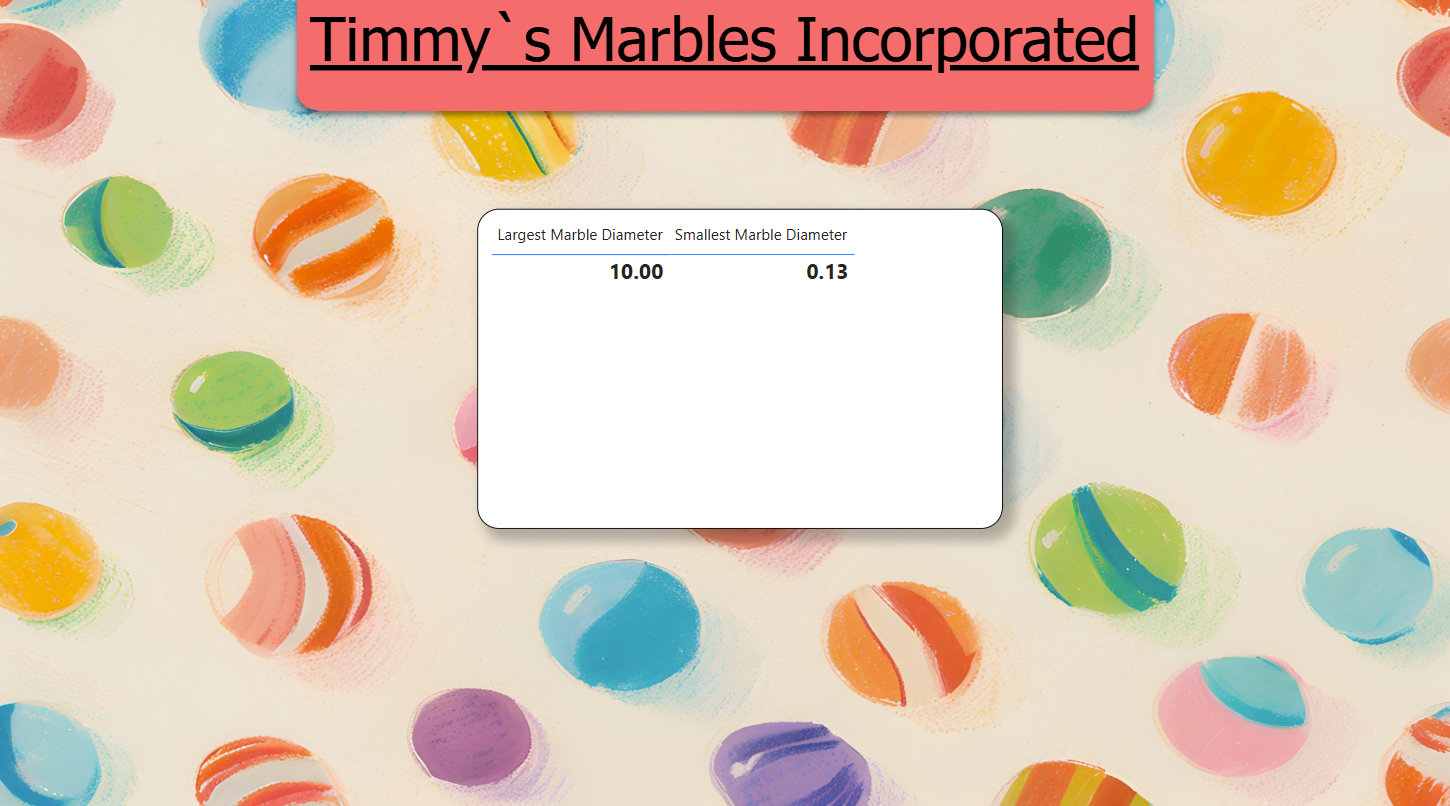
Unfortunately, Timmy was unsatisfied with the results as he wanted to know the largest and smallest marble diameter for each of his marble colors, but the visual just showed the largest and smallest diameter overall.
Here is where Filter Context comes into Play
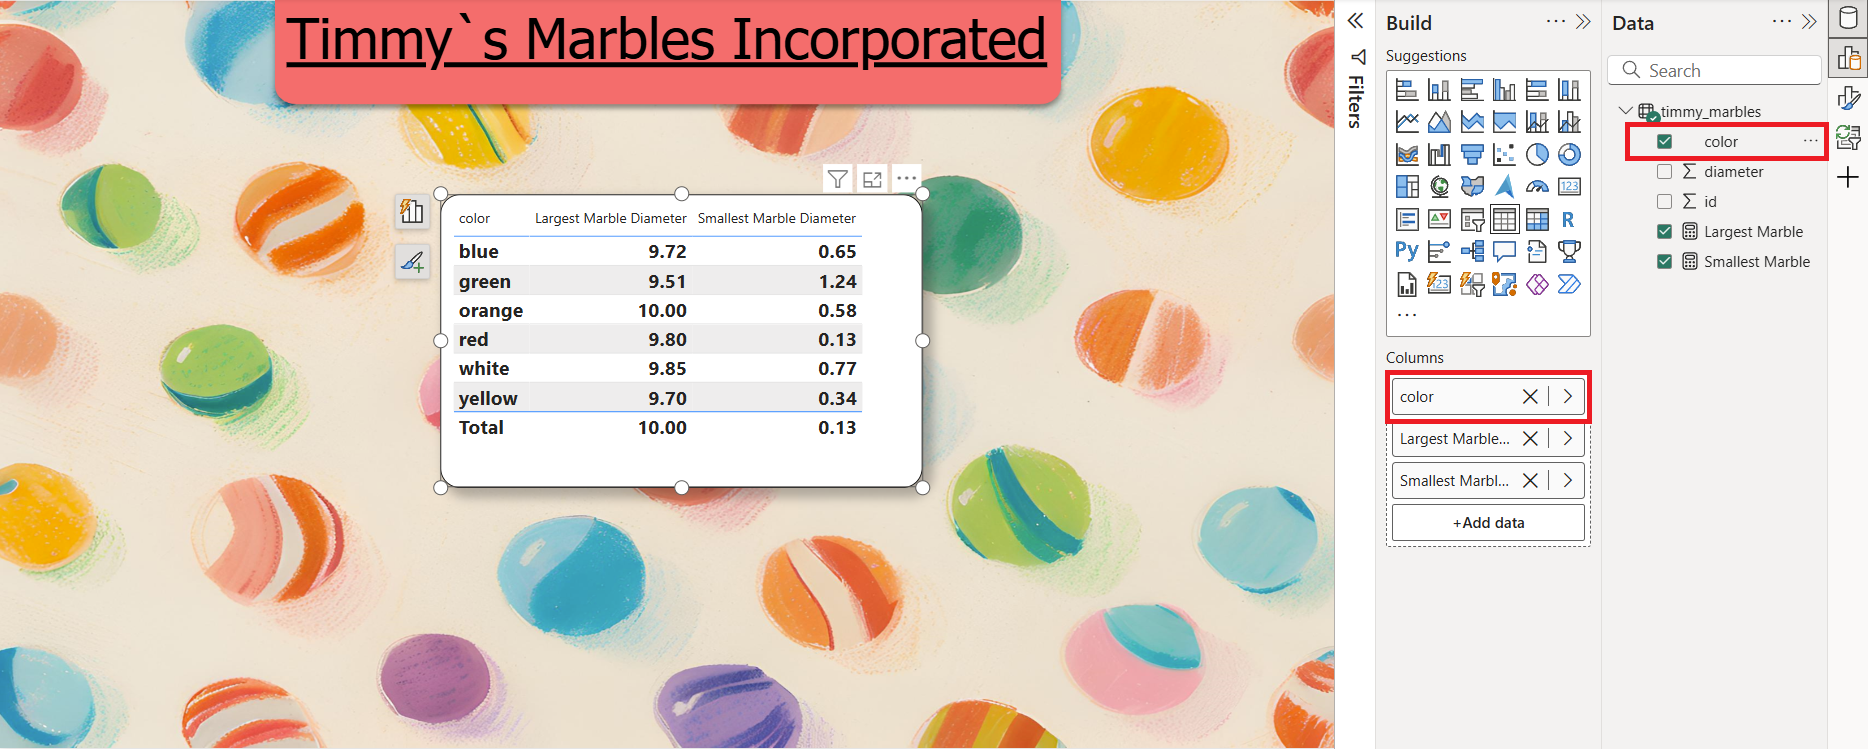
By adding the color dimension to the table as a filter context, each row in the visual will create a filter that limits the dataset, essentially creating a subset where the marble color must match the color stated in the row of the table visual, on which we will calculate the measures specified (Largest Marble Diameter, Smallest Marble Diameter), so the limit will be :
- Marble color = blue for the visual 1st row.
- Marble color = green for the visual 2nd row.
- Marble color = orange for the visual 3rd row.
- etc….
Interpretation in Pandas Python
import pandas as pd

colors = ["blue", "green", "orange", "red", "white", "yellow"]
pandas_dataframe = pd.read_csv("timmy_marbles.csv")
# The for loop will cycle through each color in the colors list.
for color in colors:
    #Create the df filter
    filt = pandas_dataframe["color"] == color
    #Filter the df by the selected color
    filtered_marbles = pandas_dataframe.loc[filt]
    #Calculate the min, max diameter for that color
    largest_marble = blue_marbles["diameter"].max()
    smallest_marble = blue_marbles["diameter"].min()

    print(color)
    print("Largest Marble Diameter:", largest_marble)
    print("Smallest Marble Diameter", smallest_marble)
Interpretation in SQL
It is the same as running this SQL query for each color in your dataset. (You can use group by color, but that’s for later)
select max(diameter) as "largest_marble",
min(diameter) as "smallest marble"
from timmy_marbles where color = "blue";
Timmy was finally able to grasp the concept of Filter Contexts in Power BI, and he was able to rest peacefully, knowing he could continue expanding his marble collection in an organized way.

Leave a Reply