
If you’ve ever written DAX code only to encounter unexpected results, it’s possible that you’ve run into Context Transition without realizing it.
Context Transition refers to a shift where a Row Context becomes a Filter Context, impacting the results of your DAX code. This effect, while powerful, can lead to surprising outcomes if not carefully managed.
This guide assumes you already have a grasp of core DAX concepts. But don’t worry I got you—if you’re unfamiliar, here’s what you might want to brush up on:
- Power BI: DAX Filter Context
- Power BI: DAX Row Context
- Power BI Measures vs Calculated Columns
- Power BI: DAX Calculate Function
So, What Triggers a Context Transition?
There are two primary conditions that initiate a context transition:
- A Row Context, either from a Calculated Column or from functions that establish a row context, such as SUMX, AVGX, etc.
- A CALCULATE function nested within this row context.
When both conditions are met, each instance of the Row Context effectively serves as a Filter Context for the CALCULATE function.
Let’s dive into an example to see how this works in a real-world scenario.
Explanation Through Story Telling:
Timmy’s business has been doing well as usual. Lately, he’s been considering getting licensed. To qualify for a certified seller badge, the marketers’ council requires each seller to have at least 20 customers who have purchased items worth $100 or more.
Previously, Timmy could create a visual to show each user’s total orders costs and even filter it down to those with $100 or more in total cost. However, counting those users manually took time.
Timmy preferred automated calculations, so he decided to use DAX instead.
Quick Refresher on How Functions like SUMX Work:
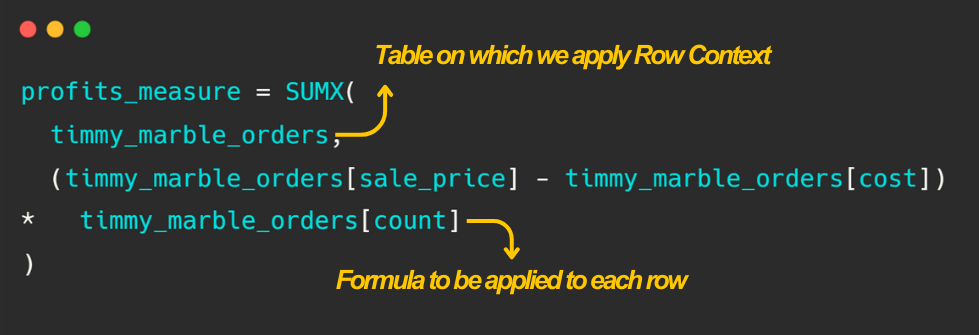
SUMX (Table, Expression)
- The first parameter in SUMX is a Table, where each row will create a Row Context.
- The second parameter is an Expression applied to each individual row within the specified table.
SUMX then evaluates the expression for each row and sums the results. So, the final result is:
SUM of (Expression for Row 1, Expression for Row 2, …, Expression for Row N)
Context Transition
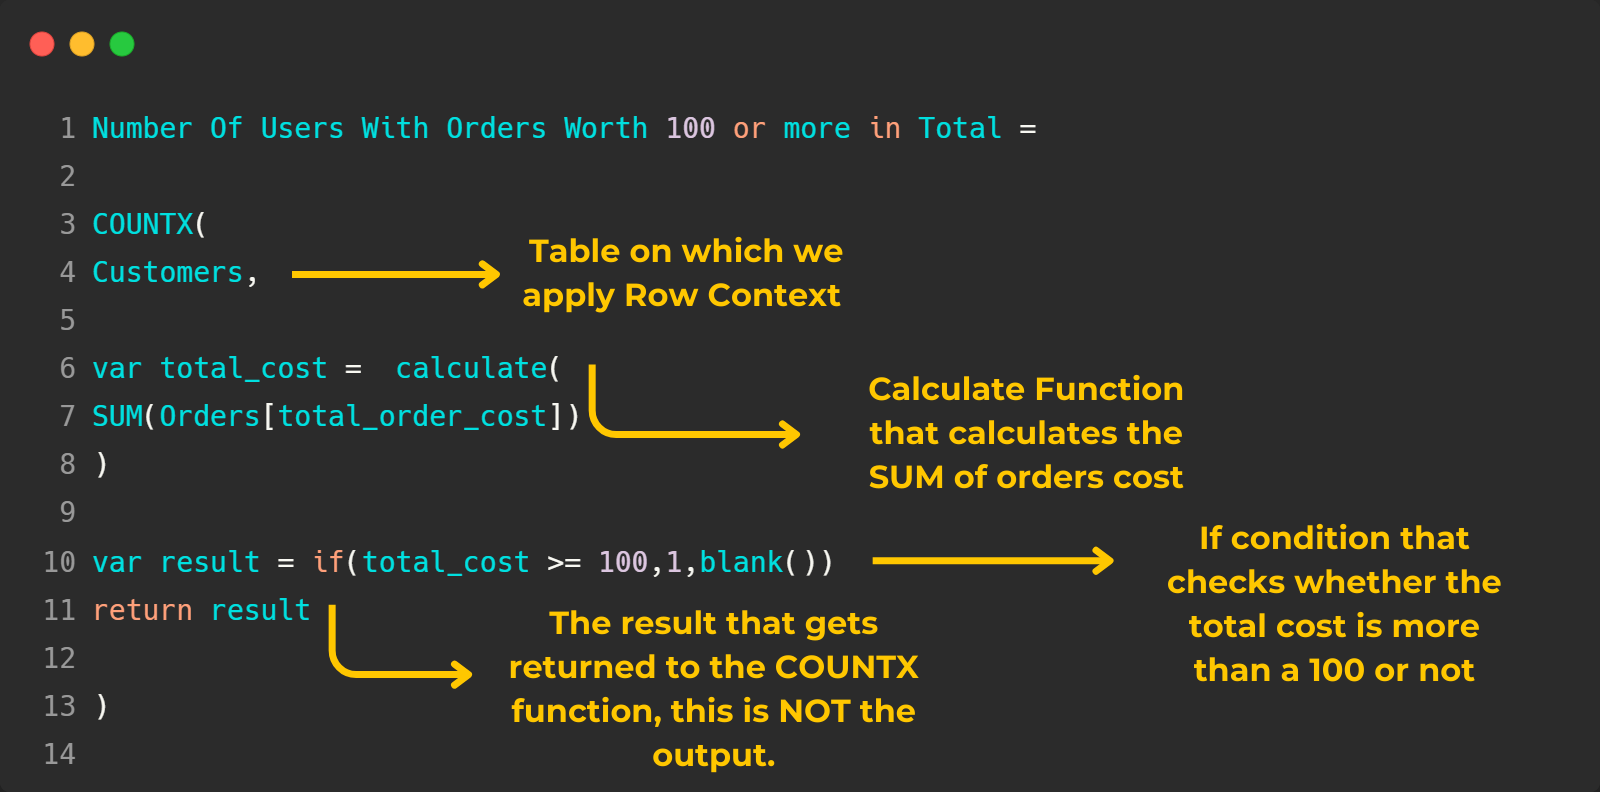
You might think: “This screenshot is nice and all, but I still don’t understand how context transition works?”
So, let us manually go through the loop of context transition so you can get a clearer view:
- COUNTX first parameter is the Customers Table, on which the Row Context is going to be applied:
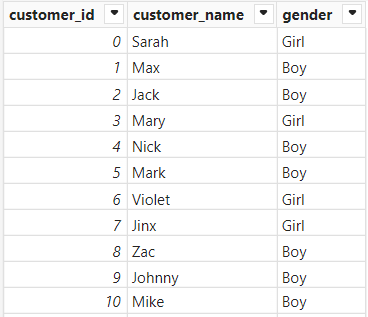
- For the first iteration of the Row Context, we will go through the first Row of the Customers Table, where the data is as follows, customer_id = 0, customer_name = Sarah, gender = Girl.
- We then meet the second part of the formula which is the calculate function, and with these two conditions we have already met the conditions of context transition, we have a Row Context and a Calculate Function being nested inside that row context.
- So now the Row Context will transition into a Filter Context, but which part of the Row Context will become the Filter Context? we do have 3 variables in that row context, the customer_id, customer_name and gender, well to understand this you have to go back to how you structured your tables in Power BI Model View.
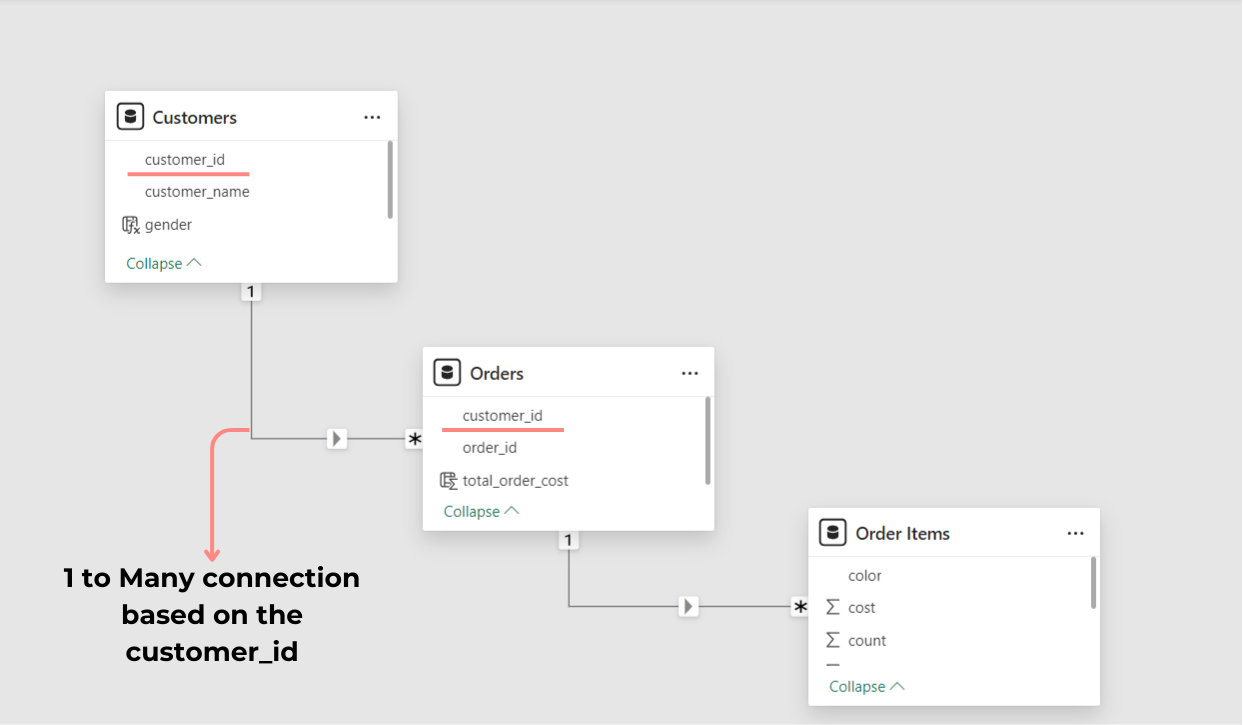
Since:
- The Row Context is based on the Customers Table
- The Calculate Function is trying to sum the total order cost from the Orders Table
- The relation that connects the Customers Table to the Orders Table is based on the customer_id.
Then:
- The part of the row context that will transform into a filter context is the customer_id, so how will this look?
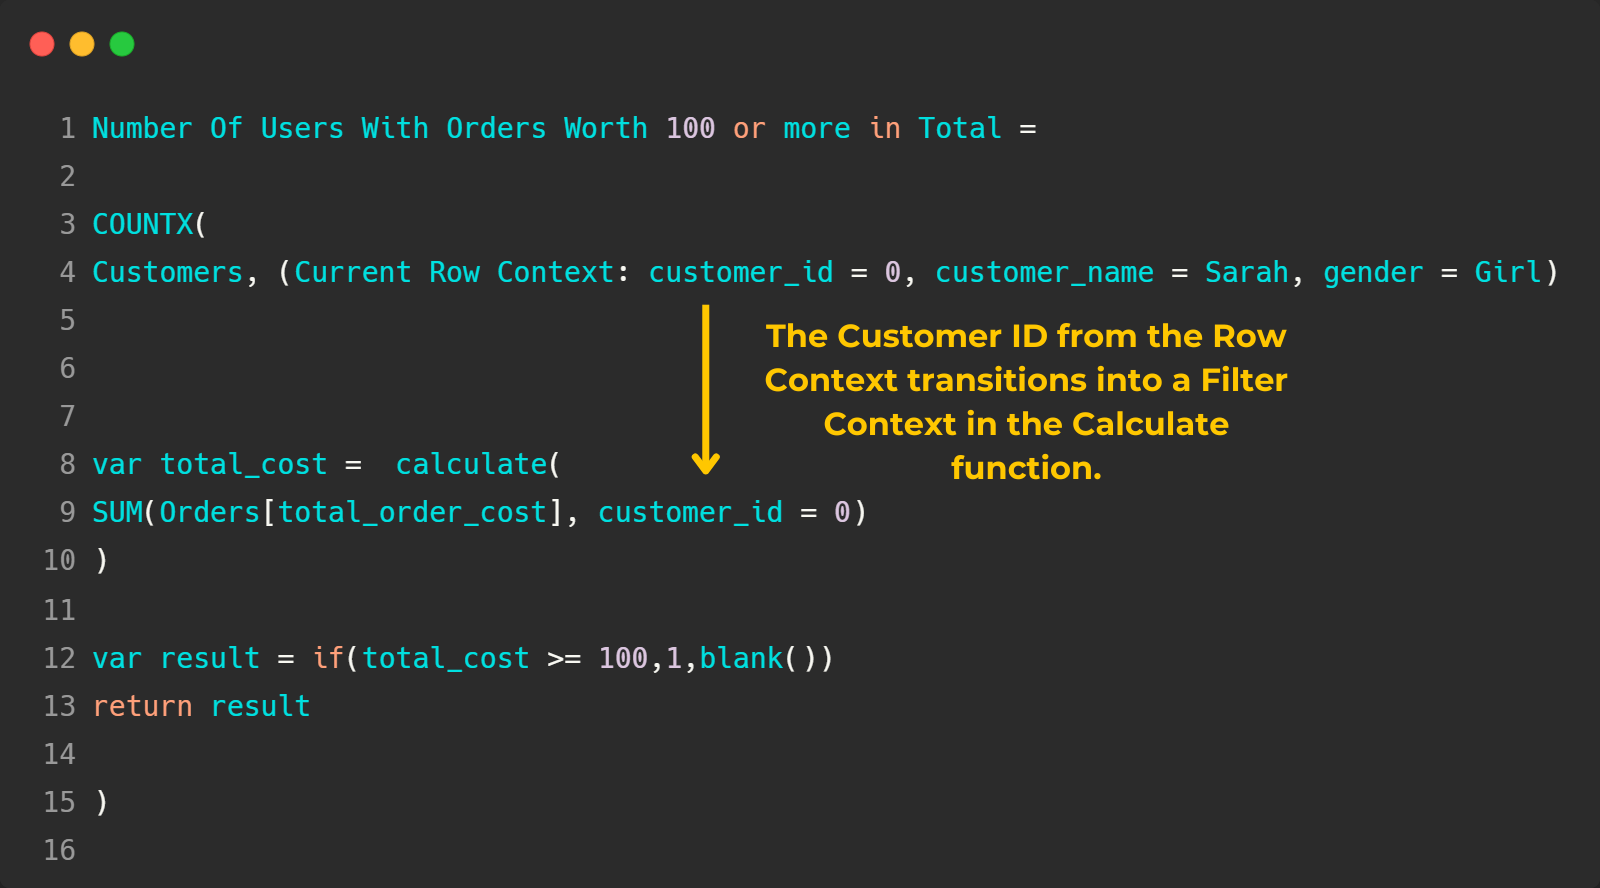
- The customer_id = 0 will become a Filter Context for the calculate function which is set to the variable “total_cost” essentially summing the order costs for that customer only.
- Now we get to the 3rd section, which is the variable “result”, the IF condition will check whether the “total_cost” variable is equal to 100 or more, if true, set result to 1, if false set result to blank.
- The final section is the return function, since in the 2nd parameter of the COUNTX function we have multiple variables instead of a singular expression, where the variables are :
– total_cost
– result
– The COUNTX function doesn’t know which one to use to base the count on, so we will use the return function to return the “result” variable to the COUNTX function.
Note: this is not the final output, this is just returning the final result of the first iteration to the COUNTX function before we proceed with the next iteration.
- So now the state of the COUNTX function is COUNTX(Already Calculated result at customer_id=0, currently calculating result at customer_id = 1)
- This will go on and on till we go through each row in the customers table, till we reach the final state of the COUNTX function : COUNTX (result at customer_id = 0, result at customer_id = 1, ….., result at customer_id = N) then the COUNTX function will count based on this condition if the result = 1, count the user, if the result is blank ignore the user.
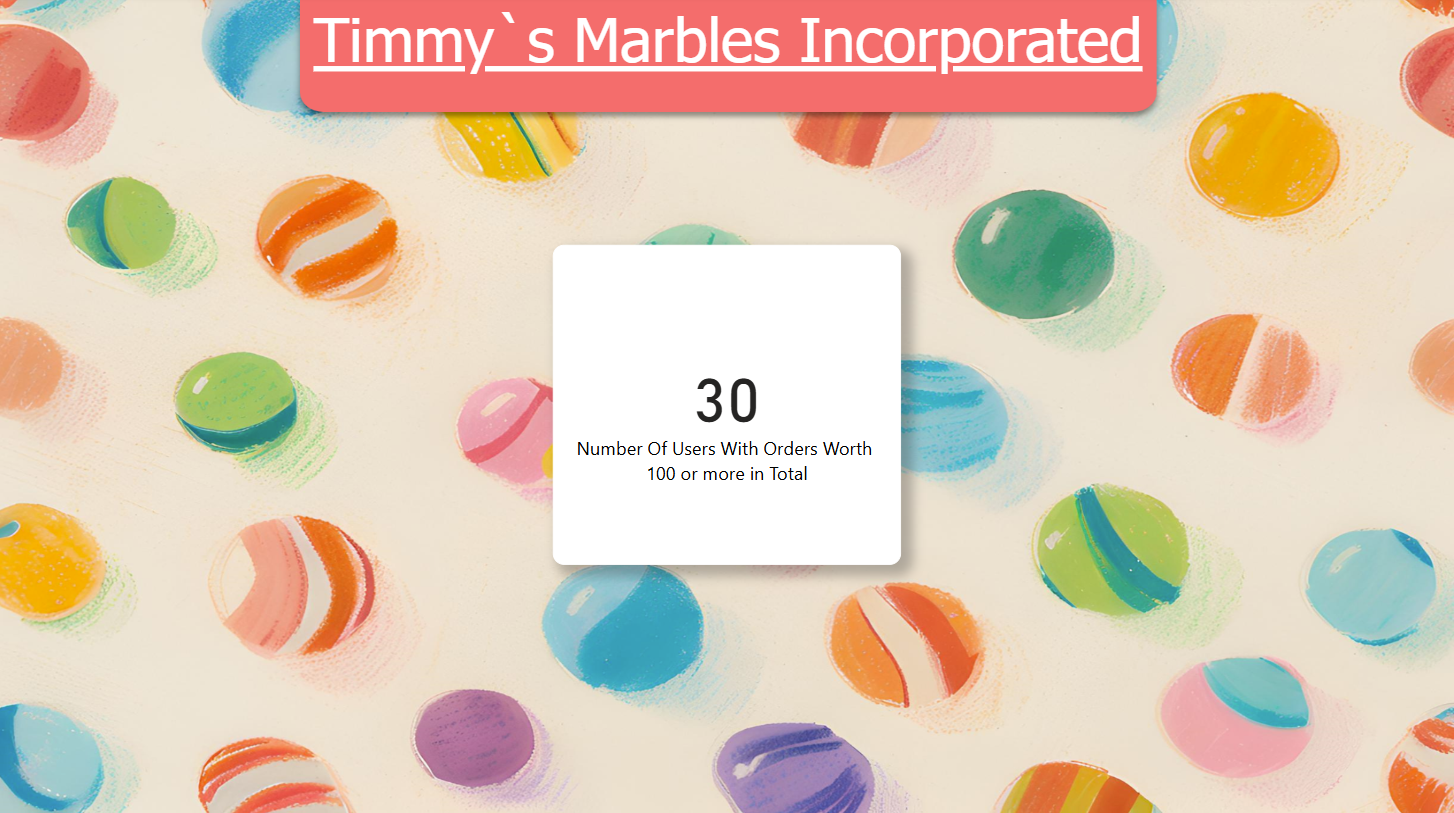
Timmy finished coding his measure and added it to a card visual in Power BI. To his delight, he found that he met the criteria to become a licensed seller: he had 30 customers with orders totaling at least 100 USD. He organized this data into a report and emailed it to Marketers` Council.
Important Remark: When you call an already created Measure, it will always be encapsulated by calculate, so this can trigger Context Transition.
New_Measure = SUMX(Customers,
    var result = [Old_Measure]
    return result
)
Although there isn’t a visible Calculate Function here, Context Transition is still triggered as there is a hidden Calculate Function since:
[Old_Measure] = Calculate (Old_Measure)
Conclusion:
In Power BI, understanding context transition is key to unlocking the full potential of DAX. This concept, where row context is transformed into filter context through CALCULATE, allows for flexible calculations. Mastering this concept will allow you to create metrics that adapt intuitively to filters and interactions, opening the door for creating clearer, more precise insights.

Leave a Reply