

The CALCULATE function is arguably the most crucial function in DAX. It’s the only function that lets you manipulate the filter context, allowing you to specify and alter the conditions under which your calculations are performed.
This blog makes the assumption that you are already familiar with both row context and filter context, if you aren’t don’t worry, I have got you:
With CALCULATE, you can apply constraints to your calculations. For example, if you want to calculate the total sales for a specific product category or find out how much profit was made from customers over the age of 50, CALCULATE is your go-to.
Let us illustrate how this works with a real-world example.
Explanation Through Story Telling:
Timmy’s marble business was thriving as usual. One night, before falling asleep, he had a curious thought—do boys or girls tend to place larger orders (Total Order Price ≥ $30)? Determined to find out, Timmy decided to create two measures for his in-depth analysis.
- The number of orders over $30 made by boys.
- The number of orders over $30 made by girls.
Applying Calculate:
First Measure:
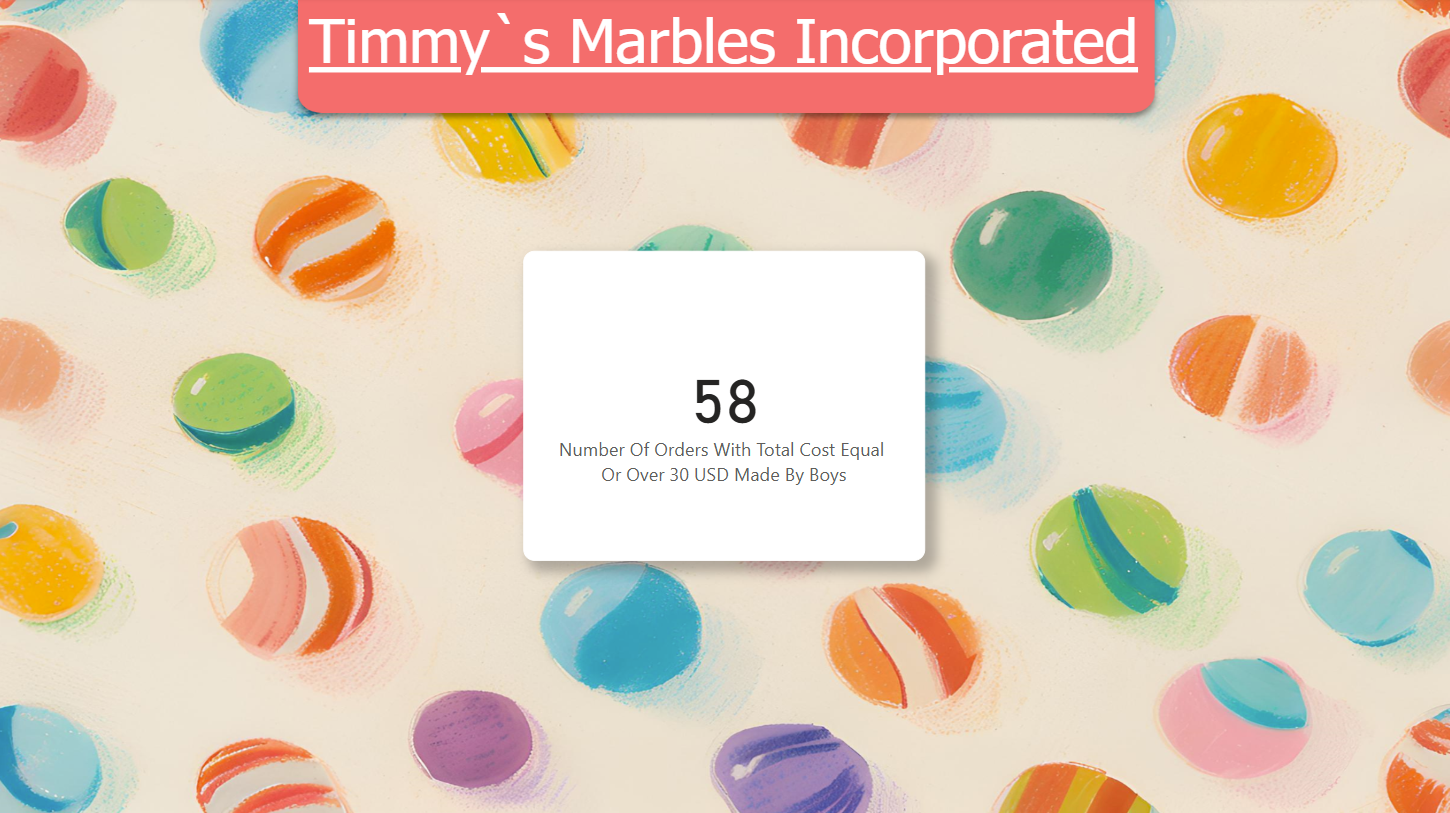
For his first measure, Timmy set out to calculate the number of orders over $30 made by boys. He wrote the following DAX formula:
Number Of Orders With Total Cost Equal Or Over 30 USD Made By Boys =

CALCULATE(
    COUNT(Orders[order_id]),
    Orders[total_order_cost] >= 30,  -- Filter 1
    Customers[Gender] = "Boy"  -- Filter 2
)
Setting the Expression to Count the number of order ID`s where the total order cost was ≥ 30$ and the Customer Gender is equal to Boy.
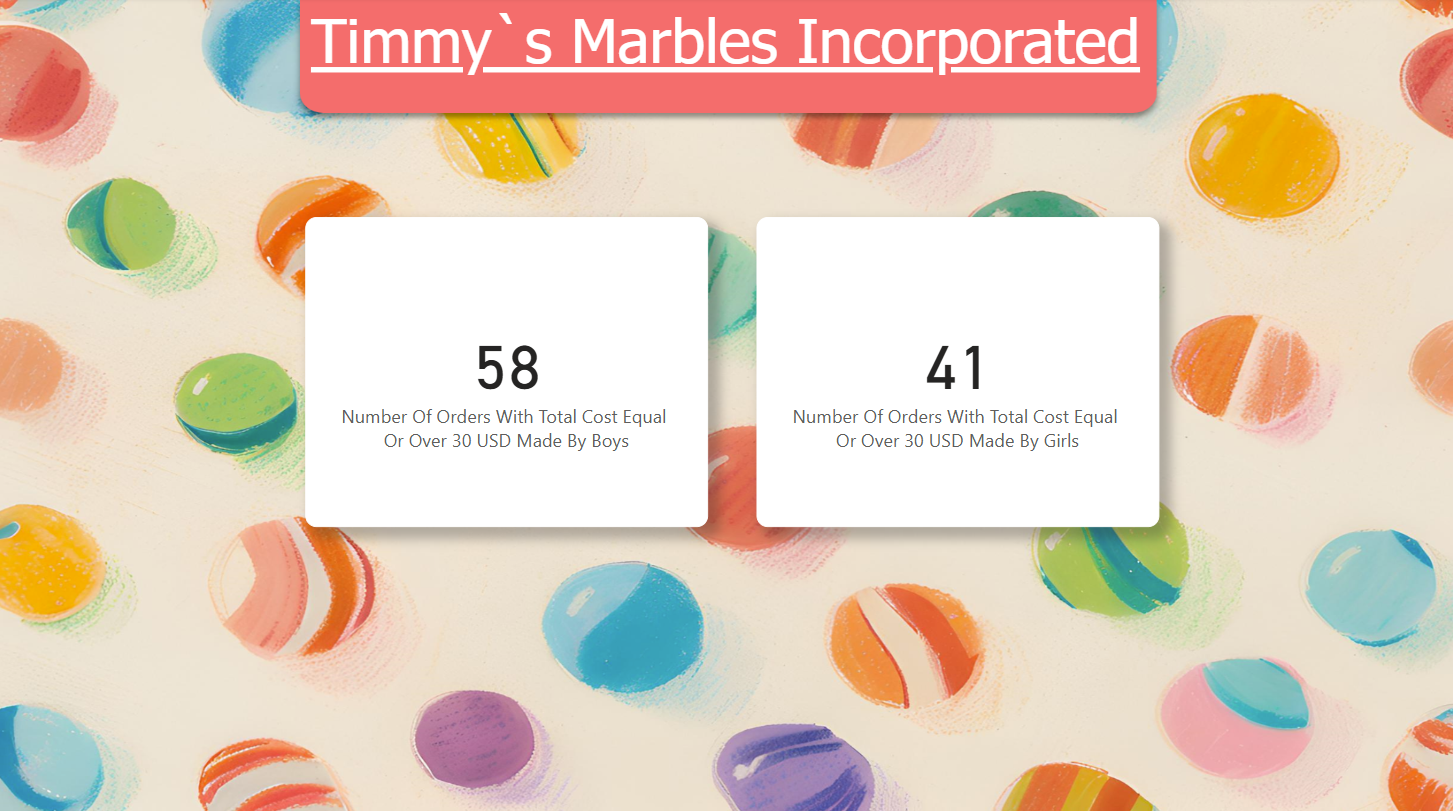
Timmy discovered that boys placed 58 orders where the total order cost was $30 or more.
Second Measure
Number Of Orders With Total Cost Equal Or Over 30 USD Made By Girls =

CALCULATE(
    COUNT(Orders[order_id]),
    Orders[total_order_cost] >= 30,  -- Filter 1
    Customers[Gender] = "Girl"  -- Filter 2
)
Timmy found out that girls have made only 41 orders where the total order cost was ≥30 $.
Interpretation using SQL:
/*
Join the customer table and the orders table keeping only the orders
made by boys where the order total is at least 30$
*/

WITH order_totals_30_and_above_made_by_boys AS (
    SELECT orders.order_id
    FROM customers
    LEFT JOIN orders ON customers.customer_id = orders.customer_id
    WHERE customers.gender = 'Boy'
      AND orders.total_order_cost >= 30
)

-- Count the number of rows in the table created above
SELECT COUNT(*)
FROM order_totals_30_and_above_made_by_boys;
Insights from Timmy’s Analysis:
Through his analysis, Timmy concluded that boys are generally more interested in marbles and are more inclined to place large orders for marbles than girls.
Conclusion:
Using CALCULATE gives you the power to alter the filter context and apply dynamic conditions to your calculations. This flexibility opens up possibilities for creating targeted metrics that provide rich, descriptive insights into your data.


Leave a Reply