Power BI Measures and Calculated Columns can seem confusing at first glance, but on breaking down their differences, it becomes easier to understand how they work and how to effectively utilize each of them.
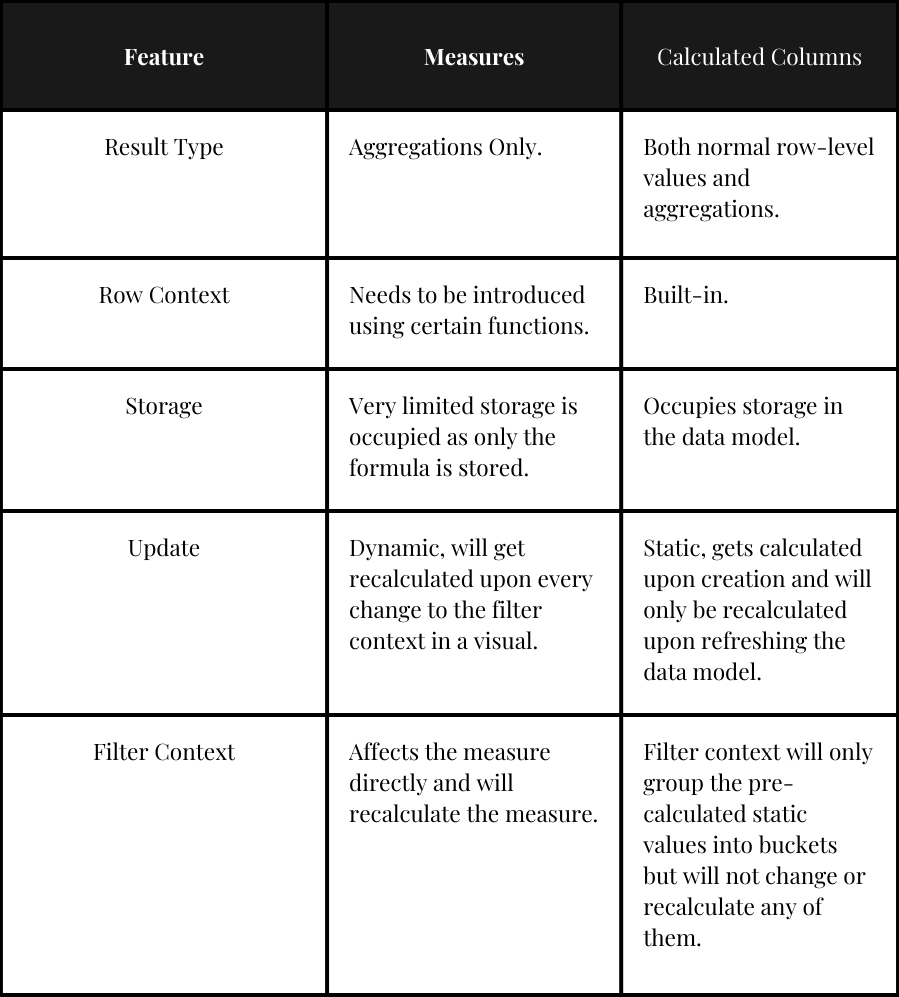
Result Type
- Measures: Measures in Power BI can only perform aggregations using functions like SUM, COUNT, and AVERAGE. They cannot calculate row-level data directly. However, functions like SUMX() enable row-level calculations within an iteration before aggregating the final result.
- Calculated Columns: Calculated columns in Power BI can perform both row-level calculations and aggregations.
Row Context
This article assumes you are already familiar with Row Context. If you’re not, don’t worry — I’ve got you covered:
- Calculated Columns have a pre-built in invisible Row Context.
- Measures do not have a pre-built in Row Context and should be introduced if necessary, using functions like:
- SUMX()
- MAXX()
- MINX()
Storage
- Calculated Columns occupy a lot of storage as the data will be stored in the data model.
- Measures do not occupy a lot of storage as only the function is saved, while the data is calculated upon the measure being added to a visualization.
Update
- Calculated columns are calculated once at creation and will not get recalculated until the data source is refreshed.
- Measures in contrast are recalculated whenever there is a change in the filter context in the visual/dropdown.
Filter Context
This article assumes you are already familiar with Filter Context. If you’re not, don’t worry — I’ve got you covered:
Calculated Columns:
Are not affected by the filter context of a visual; their calculations are static. The values are merely grouped into different buckets based on the filter context, but this does not change the values in your table or cause the calculated column to be recalculated.

- For example:
- profits_calculated_column was calculated upon creation and stored in the data-table/data-model.
- This calculation will not be updated based on any changes in the filter context from a visualization/dropdown-filters, instead the filter context acts as a bucket that will just aggregate the data stored in the table without any recalculations.
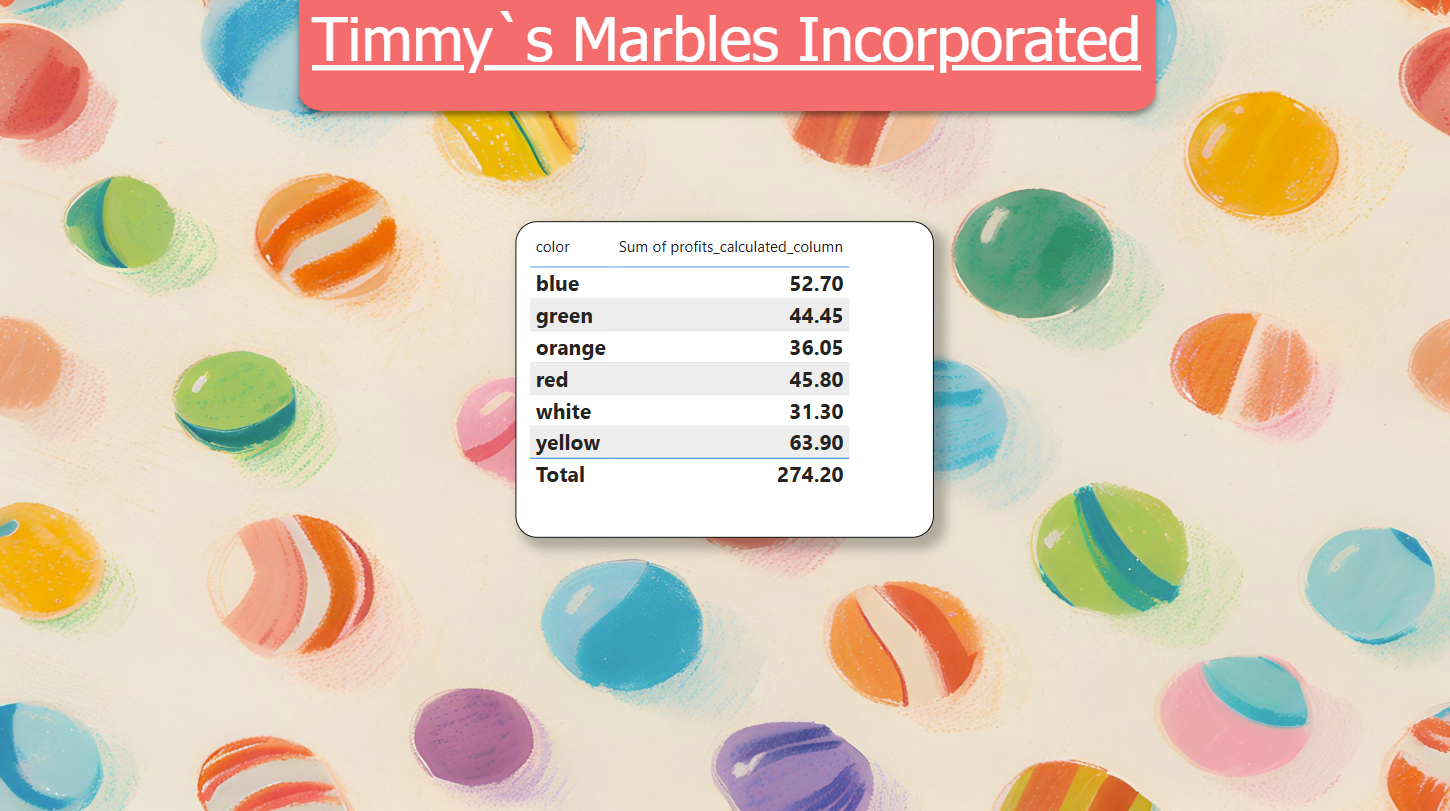
Here the Filter Context (color) will not cause a recalculation in the profits_calculated_column, each of the values of this filter context will act as a bucket that just collects the already calculated data, let us take the first row for example, the bucket will have a filter for entry where the marble has to be of the color blue, after filtering the entire dataset down to only blue marble, the values of the profits_calculated_column will be aggregated (in the case of the picture above the aggregation is the sum) without causing any recalculation in the data that exists in the table.
Measures:
Measures, on the other hand, are directly affected by filter context. Any change in the filter context of the visualization/dropdown-filter will cause the measure to be recalculated.
So, when should I use which?
As a general rule you should always try to use a measure unless, you need the data to individually exist in the Power BI Table to be used as a dimension or for a relationship between 2 tables.
Common Mistakes
- Using Measures Formula in Calculated Columns
- Using Calculated Columns Formula in Measures
Explanation through Story telling:

Timmys marble business was flourishing, he wanted to calculate the profits gained from each customer, instead of writing the formula himself, he took the easy way out and asked ChatGPT, Timmy proceeded to copy the formula into a new calculated column.
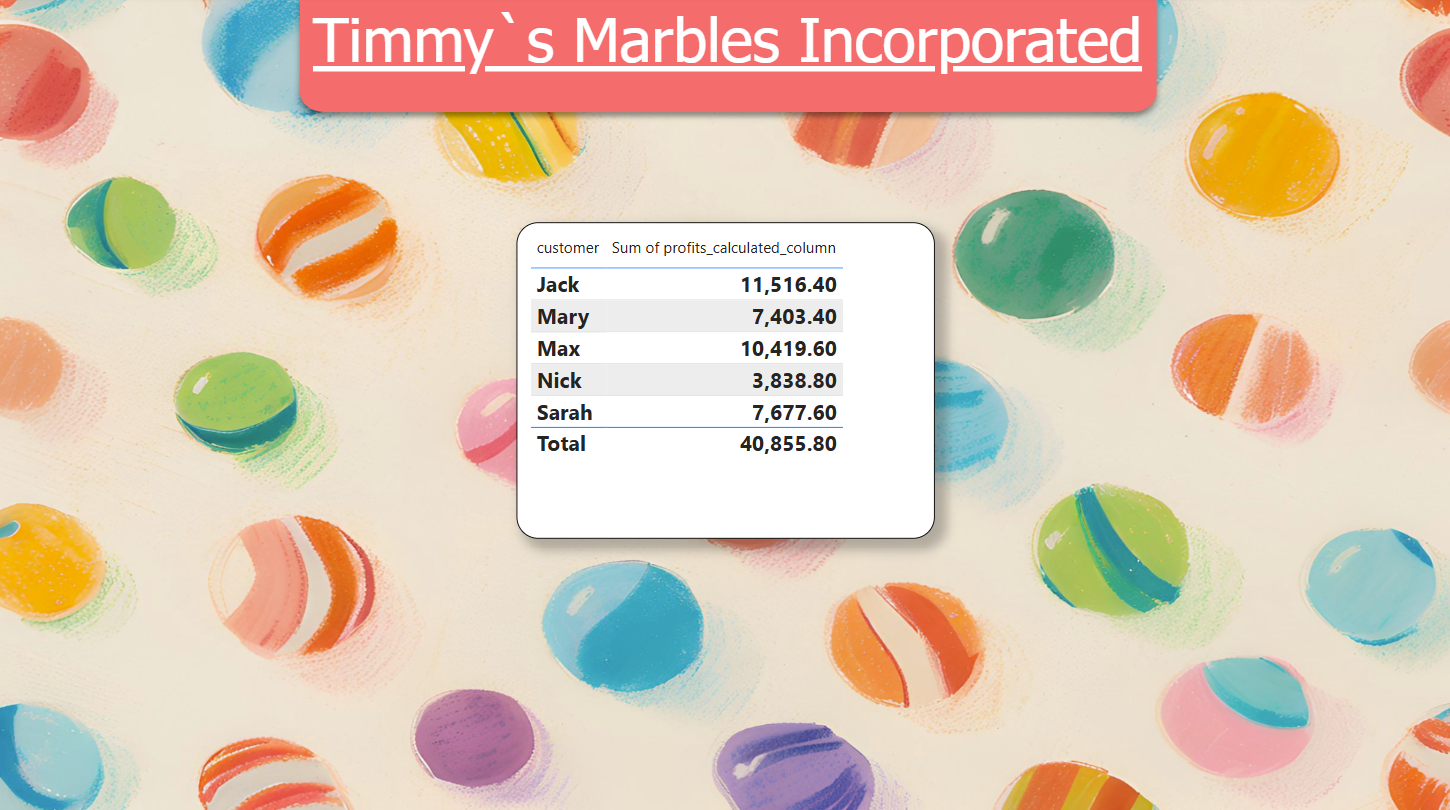
Timmy noticed that the visualization showed absurd data, either Timmy was selling something else rather than marbles or something weird was going on.
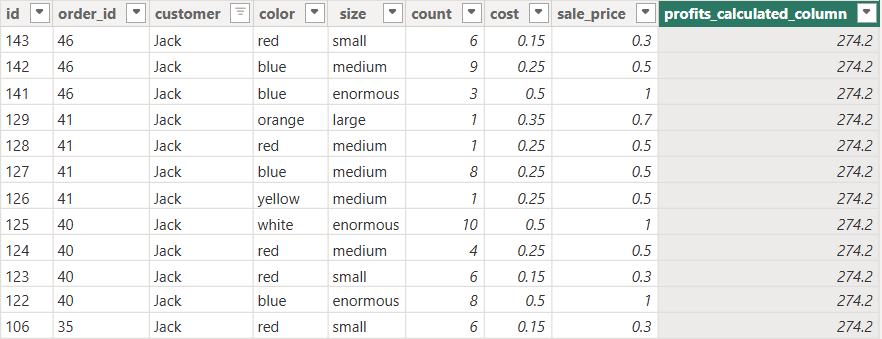
Timmy proceeded to check his data model, to see that each row in the table had the same exact value for his profit’s column, so what actually happened?
Timmy copied the Measure code from ChatGPT into a Calculated Column essentially creating a nested row context.

The outer row context (built in from the Calculated Column) will iterate over each row in timmy_marble_orders Table, then for each of these rows, the inner row context (Introduced by the SUMX function) will iterate over all the rows again, essentially calculating the total profit of the entire business rather than calculating the profit for that singular row.
Interpretation In Python:
orders = {1: {"cost": 4, "sale_price": 8}, 2: {"cost": 3, "sale_price": 9}, 3: {"cost": 2, "sale_price": 5}, 4: {"cost": 1, "sale_price": 7}}

# Loop over each order in the dictionary
for idA, orderA in orders.items():
    profit = 0
    # For each of the orders in the outer loop, loop over all the orders again and sum the profit of each order
    for idB, orderB in orders.items():
        profit += orderB["sale_price"] - orderB["cost"]
    orders[idA]["profit"] = profit

print(orders)
Vice Versa
(timmy_marble_orders[sale_price] - timmy_marble_orders[cost]) * timmy_marble_orders[count]If Timmy copied a Calculated Column Formula into a Measure, it would not run and it will give an error, since there is no Row context introduced by a function, so the measure doesn’t know which value to use for each of the columns of sale_price, cost, count as there is no aggregation such as Sum, Count etc..
Power BI Measures and Calculated Columns operate differently, making it essential to understand their distinct processes. Knowing how each one works is crucial for determining the right time and place to use them effectively in your data analysis and reporting.



Leave a Reply